Spreadsheets
Machine Learning via High School CrushesGoal and Audience
I like spreadsheets. They’re super underrated as a way to build really quick and shareable tools. Here are three that I’m proud of.
This piece may be relevant if:
- you’re curious about what I’ve built
- or you have opinions on spreadsheets.
Schedule Builder
My high school let us choose courses pretty flexibly. Eight per semester across a breadth of fields. With some requirements, of course. This would inevitably lead to scheduling challenges: what can I take, and when? If I take this Design Thinking class, can I still take the Stained Glass course? When are the different Science of Mind sections offered? Can I fit my requirements in?
Even figuring out the possible options was difficult, so I built a spreadsheet to help people figure it out. I set up automatic visualization, script-generated conditional formatting rules, and a few little input validation rules to make the UX clean enough to use.
Reviews were good! People found it useful. I’ve put a copy of Schedule Builder (2020 Edition) online, if you want to see what it looked like. (We had some pretty cool course offerings.)
I’d later learn that this is similar to constraint solving problems, and that strategies and tools exist to solve scheduling tasks. Looking back on it, I think this is still the best solution for helping people figure out their courses. I don’t necessarily want a program to tell me what to take. I’d rather be involved in the process of figuring it out for myself. (I guess that’s the copilot model.)
Electricity Markets Strategy via Spreadsheet
The UC Berkeley Electricity Strategy Game is a (very simplified) simulation of the California energy markets. My high school economics teacher Patrick Berger got our environmental econ class in on it, and we competed to see which team could make the most money. The big challenge was predicting how the other teams would price their electricity. With demand predictions and symmetric information about asymmetric production capacities, the primary question is How much is a power plant worth? And how should you play the initial auction? Hence the spreadsheet.
Then our team realized something that the other teams didn’t. It turns out that the market was not so simple. I won’t say exactly what we did publicly (in case there are any current students reading this), but you’re welcome to shoot me a message if you want to see a copy of the sheet.
I was recently informed by some friends in investment banking that all of finance is actually run via Excel. Dear god.
Machine Learning via High School Crushes
Suppose you’ve gained a reputation for being good with spreadsheets and even better with secrets. Now suppose you’ve gotten a good chunk of the Nueva Class of 2020 to (voluntarily) list everyone they’ve had a crush on via a google form (anonymously). You’ve got a big list of lists of names. What can you do with this information?
Well, you can’t really matchmake people because not everyone submitted the form with their name. But there’s still tons of interesting questions to answer! Like: How often does someone like both Person A and Person B? And if you like Person C, who else are you likely to like? And what’s the Gini coefficient of the crush distribution among our class? (These were very exciting questions for our class.)
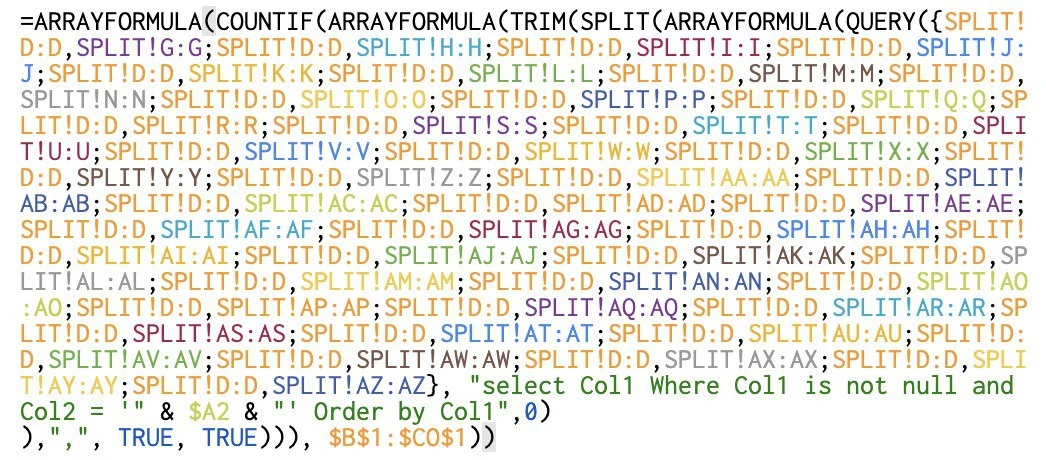
Having just come out of linear algebra, it seemed very natural to answer these questions by representing each survey response as a vector of binary digits, in which each index corresponded to a particular crush-recipient. Then answering the first question becomes just a matter of computing and storing a coincidence matrix. Our answer to the second question was a very simple dot product between Person C’s row in that matrix and every other person, and then sorting the results by overlap. We came up with a clever codename-based redaction scheme to allow people to identify themselves in the anonymized results. People seemed happy with it!
I’d later learn the terms “vector encoding” and “bag of words” and “cosine similarity.” Turns out other people have thought about similar problems in with like, actual rigor and less silliness. Who would’ve thought.
The Gini coefficient (in which “wealth” corresponds to “having people crush on you”) was about 0.498. I believe that’s usually considered reflective of severe inequality.
Etc
I’m a fan of spreadsheets. I’ve made many more since and will continue to lean on them as a lightweight tool for shareable computation. I’ve yet to find a tool that’s more painless than Google Sheets — it’s the lowest common denominator, and that’s worth a lot. (Excel is powerful, but having everything in a browser is so much easier. Airtable is a little bit difficult for new users, and as such there’s more friction than with a simple google sheet.)
